


- Bitcoin price climbed higher sharply after diving below the $3,480 support level against the US Dollar.
- Yesterday’s highlighted key bearish trend line is intact with resistance near $3,600 on the hourly chart of the BTC/USD pair (data feed from Kraken).
- The price is facing a crucial resistance near $3,600, above which it could rally towards $3,700 or $3,750.
Bitcoin price is showing positive signs above the $3,520 level support against the US Dollar. Having said that, BTC is struggling to clear the key $3,600 resistance level.
Bitcoin Price Analysis
Yesterday, we discussed the chances of more losses below the $3,500 level in bitcoin price against the US Dollar. The BTC/USD pair did decline below the $3,500 and $3,480 support levels. The pair spiked towards the $3,450 level and later bounced back. Buyers were successful in pushing the price back above $3,480 and $3,500. It can be considered as a false break since there was no hourly close below $3,480. The recent recovery was solid above $3,550 and the 50% Fib retracement level of the downside move from the $3,700 swing high to $3,465 low.
However, the price ran into a significant resistance near $3,600 and the 100 hourly simple moving average. More importantly, yesterday’s highlighted key bearish trend line is intact with resistance near $3,600 on the hourly chart of the BTC/USD pair. Finally, the 61.8% Fib retracement level of the downside move from the $3,700 swing high to $3,465 low is also acting as a hurdle. Therefore, there are two possible scenarios, with the pivot level at $3,600. First, the price breaks the trend line and $3,600 to start a solid upward move. Second, buyers fail to gain traction above $3,600, resulting in a drop back to $3,500.
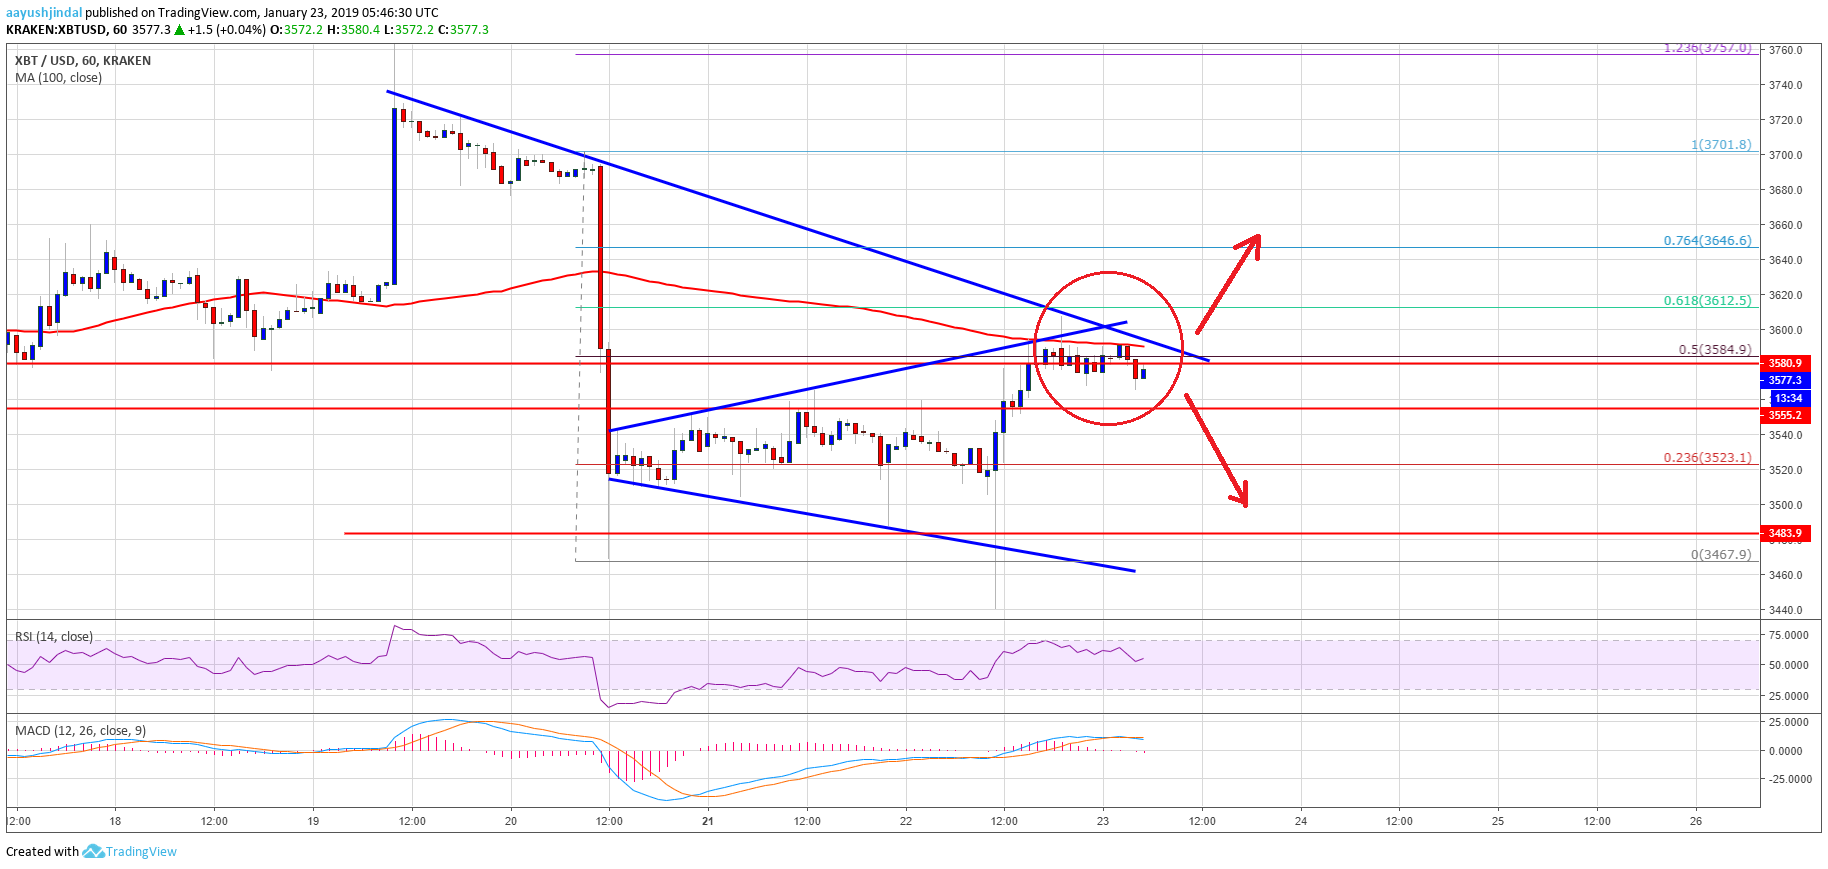
Looking at the chart, bitcoin price seems to be trading near a crucial juncture at $3,600. There are high chances of more gains, but it won’t be easy for buyers to clear the $3,600 barrier.
Technical indicators
Hourly MACD – The MACD for BTC/USD is slowly moving back in the bearish zone.
Hourly RSI (Relative Strength Index) – The RSI for BTC/USD is currently placed nicely above the 50 level.
Major Support Level – $3,500
Major Resistance Level – $3,600