


- Bitcoin price remained in a bearish zone below the $3,580 and $3,600 resistance levels against the US Dollar.
- There is a major bearish trend line in place with resistance near $3,600 on the hourly chart of the BTC/USD pair (data feed from Kraken).
- The price is currently trading inside an expanding triangle with resistance near the $3,580 level.
Bitcoin price started consolidating losses above the $3,480 support against the US Dollar. BTC is likely to face a strong selling interest near the $3,580 and $3,600 levels.
Bitcoin Price Analysis
Yesterday, there was a significant downward move below the $3,650 support level in bitcoin price against the US Dollar. The BTC/USD pair even traded below the $3,560 support level and the 100 hourly simple moving average. It spiked below the $3,500 support and a low was formed near the $3,465 level. Later, the price recovered a few points above the $3,500 and $3,525 resistance levels. Besides, there was a break above the 23.6% Fib retracement level of the last drop from the $3,701 swing high to $3,467 low.
However, the previous support near the $3,550 and $3,560 levels acted as a strong barrier for buyers. The price even struggled to test the 50% Fib retracement level of the last drop from the $3,701 swing high to $3,467 low. There were a couple of swing moves near the $3,550 level, with no upside break. At the outset, the price is trading inside an expanding triangle with resistance near the $3,580 level. Moreover, there is a major bearish trend line in place with resistance near $3,600 on the hourly chart of the BTC/USD pair. Therefore, a break above the $3,580 and $3,600 resistance levels is needed for a decent recovery.
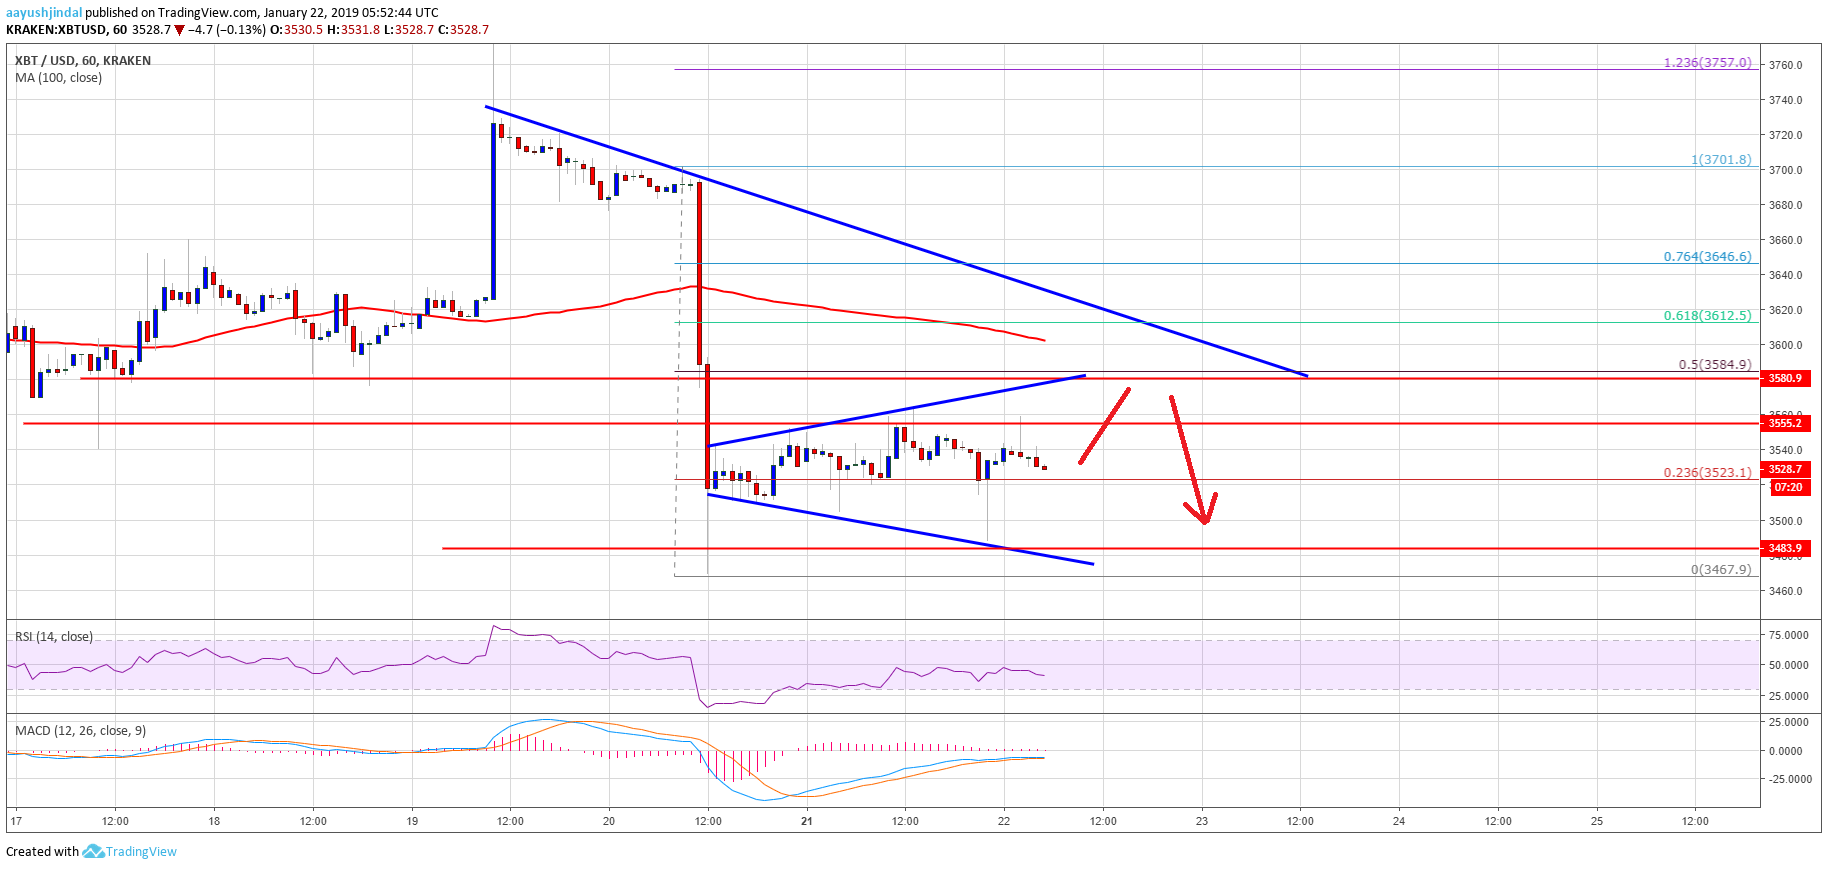
Looking at the chart, bitcoin price may continue to trade in a range below the $3,550 and $3,580 levels. The next move in BTC could be either above the $3,600 resistance or below $3,480.
Technical indicators
Hourly MACD – The MACD for BTC/USD is about to gain traction in the bearish zone.
Hourly RSI (Relative Strength Index) – The RSI for BTC/USD is currently well below the 50 level, with a bearish angle.
Major Support Level – $3,480
Major Resistance Level – $3,600