


- Bitcoin price failed near key resistances at $3,600 and $3,620 against the US Dollar.
- This week’s followed key bearish trend line is in place with resistance near $3,570 on the hourly chart of the BTC/USD pair (data feed from Kraken).
- The price may continue to move down unless buyers gain strength above the $3,600 and $3,620 levels.
Bitcoin price struggled to surpass the $3,600 pivot zone against the US Dollar. BTC is currently at a risk of more losses towards $3,480 as long as the price is below $3,620.
Bitcoin Price Analysis
Yesterday, we saw a solid upward move above the $3,560 resistance in bitcoin price against the US Dollar. However, the BTC/USD pair ran into a significant resistance area near the $3,600 and $3,620 levels. There was a rejection pattern formed near the $3,615 level. The price also failed to settle above the 61.8% Fib retracement level of the last drop from the $3,708 swing high to $3,465 low. An intraday high was formed at $3,614 and later the price declined below the 100 hourly simple moving average.
The decline was such that the price traded below the $3,560 level. It tested the 50% Fib retracement level of the recent wave from the $3,441 low to $3,614 high. The current price action is clearly bearish below $3,580 and it seems like there could be more declines. The next stop for sellers could be near the $3,500 level and the 61.8% Fib retracement level of the recent wave from the $3,441 low to $3,614 high. Below $3,500, the price is likely to test the $3,480 and $3,460 support levels. On the upside, there are many barriers near the $3,600 level. Moreover, this week’s followed key bearish trend line is in place with resistance near $3,570 on the hourly chart of the BTC/USD pair.
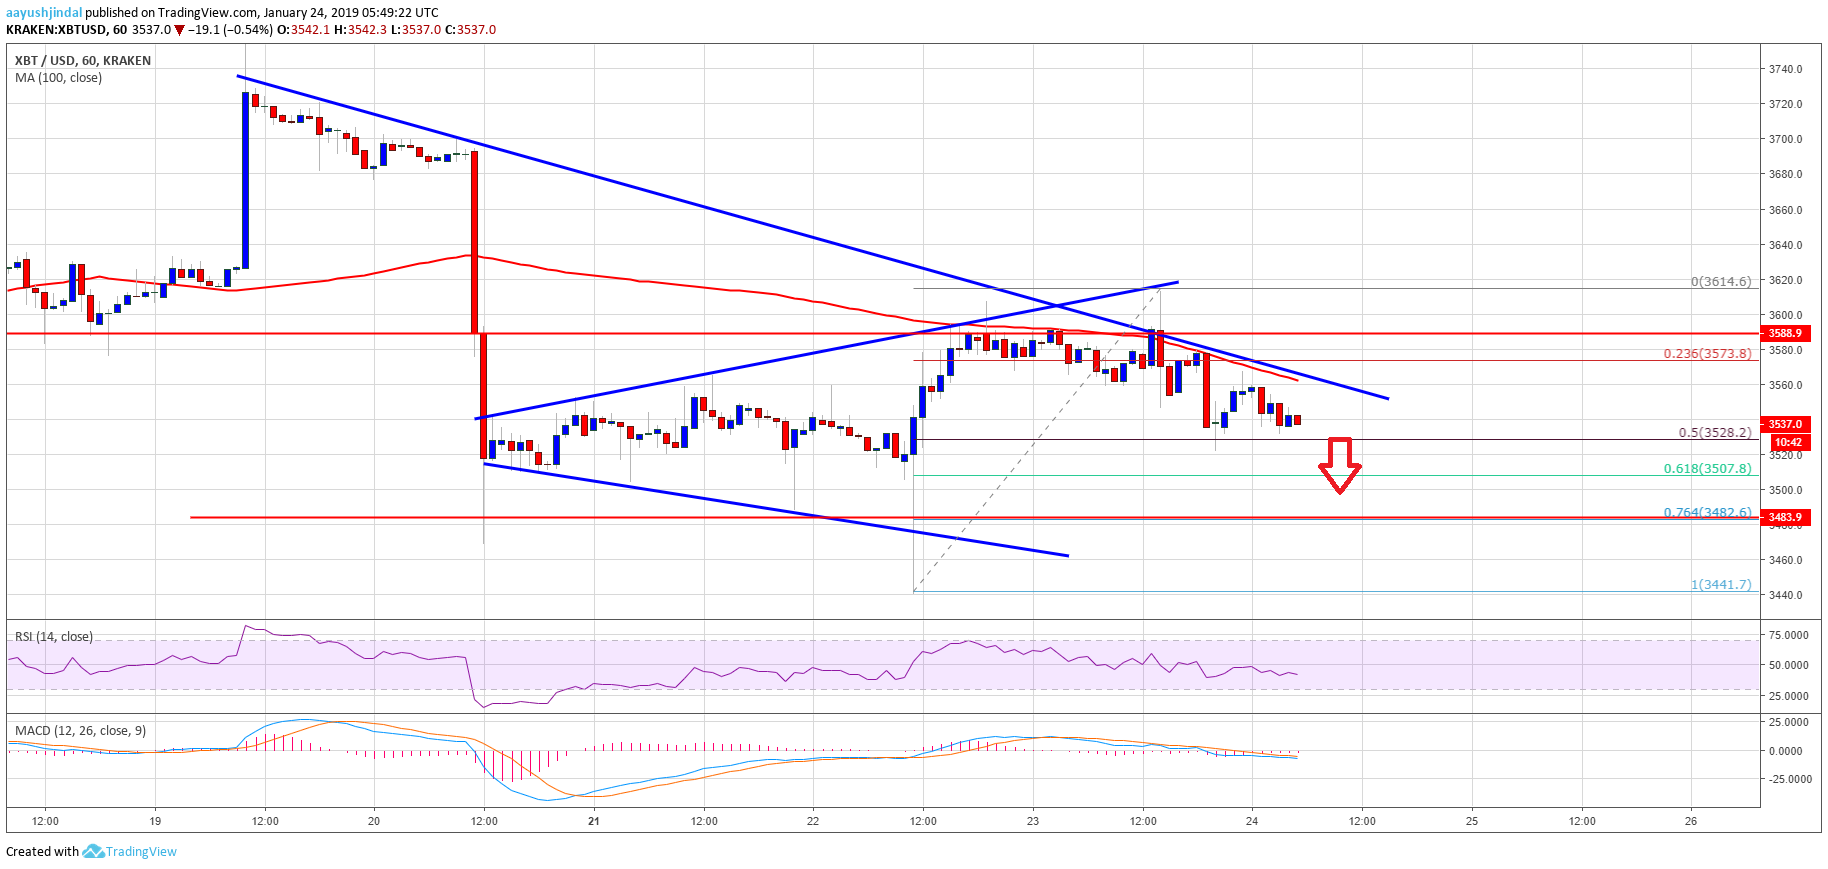
Looking at the chart, bitcoin price is clearly facing a significant barrier near $3,600 and $3,600. Therefore, it could extend the current decline to $3,480 before a fresh upward move.
Technical indicators
Hourly MACD – The MACD for BTC/USD is now placed heavily in the bearish zone.
Hourly RSI (Relative Strength Index) – The RSI for BTC/USD is currently placed well below the 40 level.
Major Support Level – $3,480
Major Resistance Level – $3,600