
- Ripple price traded towards the $0.3100 level recently and later started a correction against the US dollar.
- There was a break above a connecting bearish trend line with resistance at $0.3180 on the hourly chart of the XRP/USD pair (data source from Kraken).
- The pair is currently following an ascending channel with support at $0.3160 on the same chart.
Ripple price is slowly recovering against the US Dollar and Bitcoin. However, XRP/USD is likely to face a lot of hurdles on the upside near the $0.3220 and $0.3250 levels.
Ripple Price Analysis
Yesterday, there was a sharp decline in ripple price below $0.3300 similar to Ethereum and bitcoin against the US Dollar. The XRP/USD pair even broke the $0.3200 support and settled below the 100 hourly simple moving average. It traded close to the $0.3100 level and formed a low at $0.3102. Later, the price started a short term upside correction and traded above $0.3150 and $0.3160. Buyers pushed the price above the 23.6% Fib retracement level of the recent slide from the $0.3350 high to $0.3100 low.
Moreover, there was a break above a connecting bearish trend line with resistance at $0.3180 on the hourly chart of the XRP/USD pair. The pair traded towards the $0.3220 level, which acted as a solid resistance. However, there was no test of the 50% Fib retracement level of the recent slide from the $0.3350 high to $0.3100 low. Therefore, there are chances of more upsides towards the $0.3225 and $0.3250 levels. The price action is still bearish and it seems like it won’t be easy for buyers to clear the $0.3220 and $0.3250 resistances.
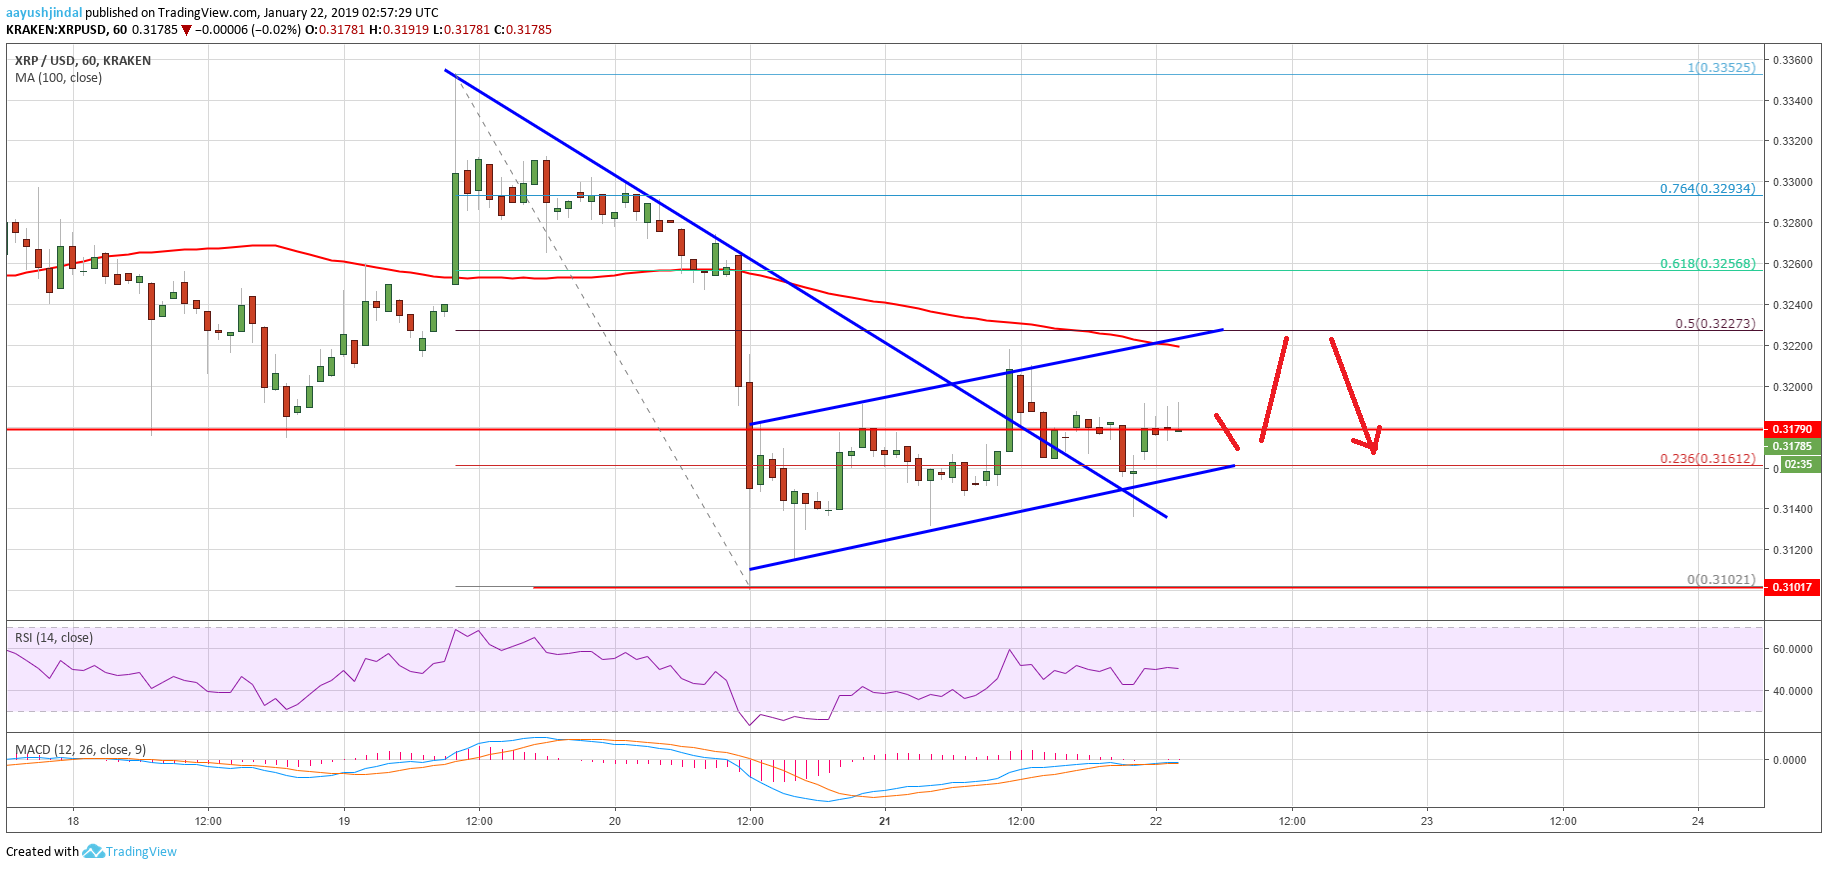
Looking at the chart, ripple price is currently following an ascending channel with support at $0.3160. There could be a short term spike towards the channel resistance, $0.3220, and the 100 hourly SMA. A failure to gain momentum above these barriers could result in a fresh decline to $0.3100.
Technical Indicators
Hourly MACD – The MACD for XRP/USD is about to move back in the bearish zone.
Hourly RSI (Relative Strength Index) – The RSI for XRP/USD is currently near the 50 level, with a flat bias.
Major Support Level – $0.3160
Major Resistance Level – $0.3220